
Emily Eckey
Index and CSS Designer
An undergraduate student majoring in Informatics along with a minor in Data Science. Passionate about data science, data visualization, and how data can tell stories.
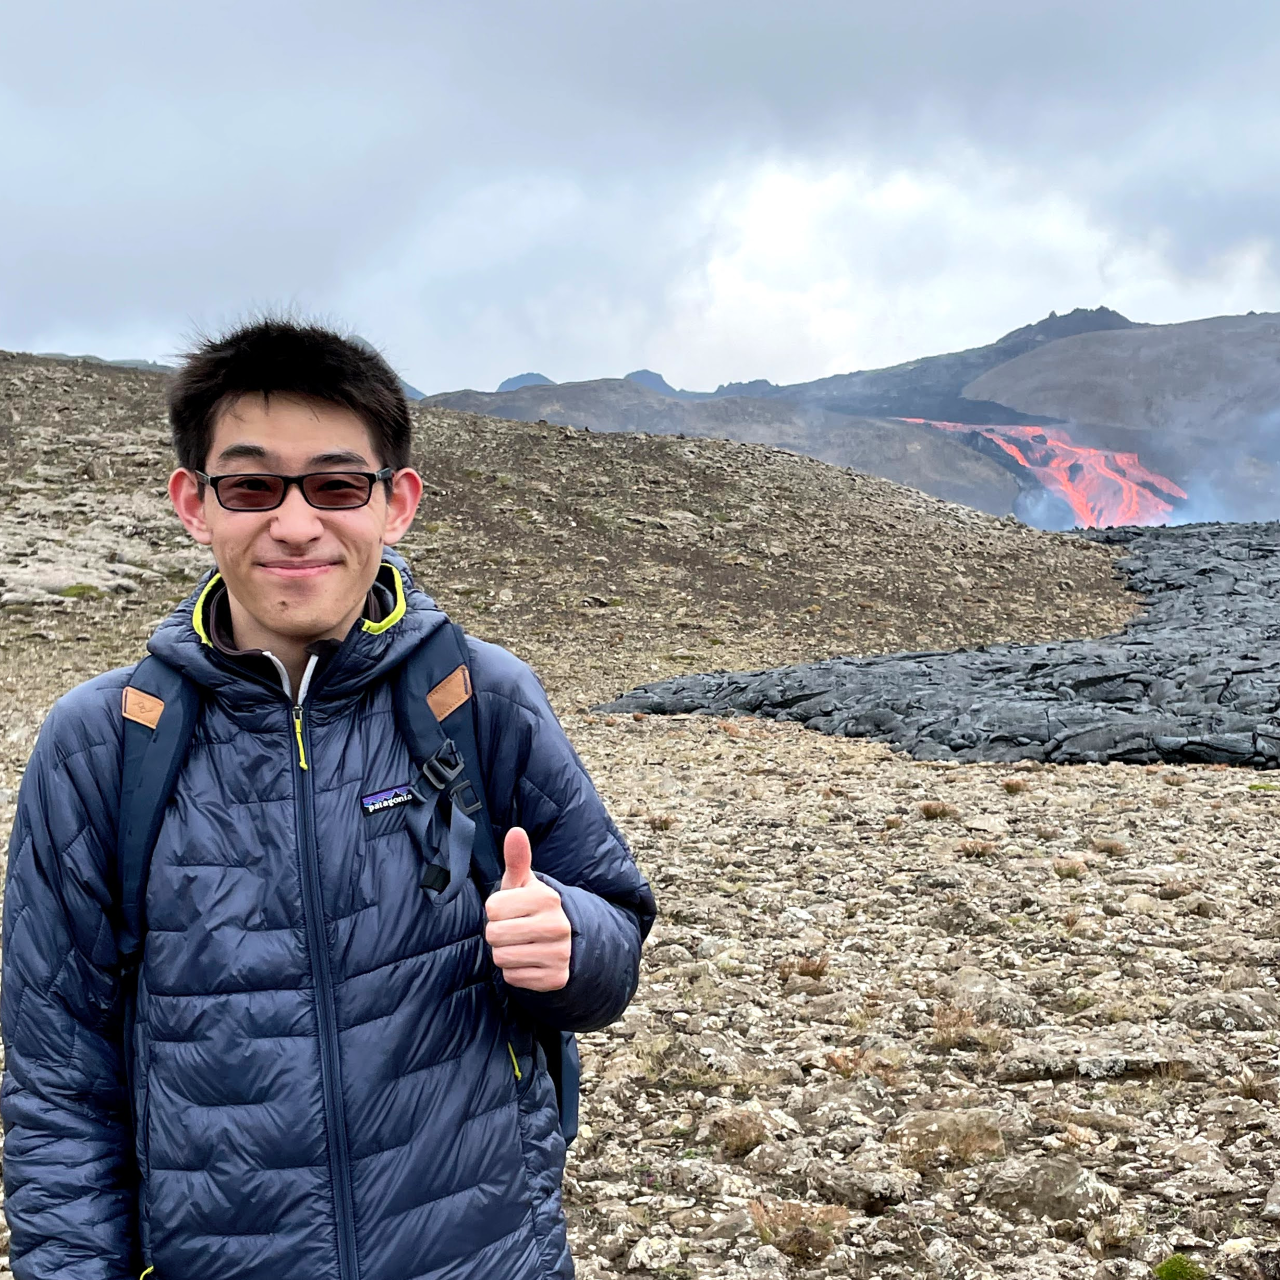
Michael Tam
Map 1 Designer
An undergrad Geography (GIS) student that loves traveling and has been to 12 countries so far. Excited to see how maps can tell the stories of people moving around the world.

Bennett Olsen
Map 2 Designer
An undergraduate student majoring in Geography: Data Science with a double minor in Informatics and Music. Eager to learn more about the uses of digital mapping and data to create tools that help others.

Ryan Singh
Map 3 Designer
An undergraduate student majoring in Geography: Data Science with a double minor in Informatics and Music. Fascinated by the capacities of technology and data to help people better understand the world. Interests in public health, healthcare, and social science.
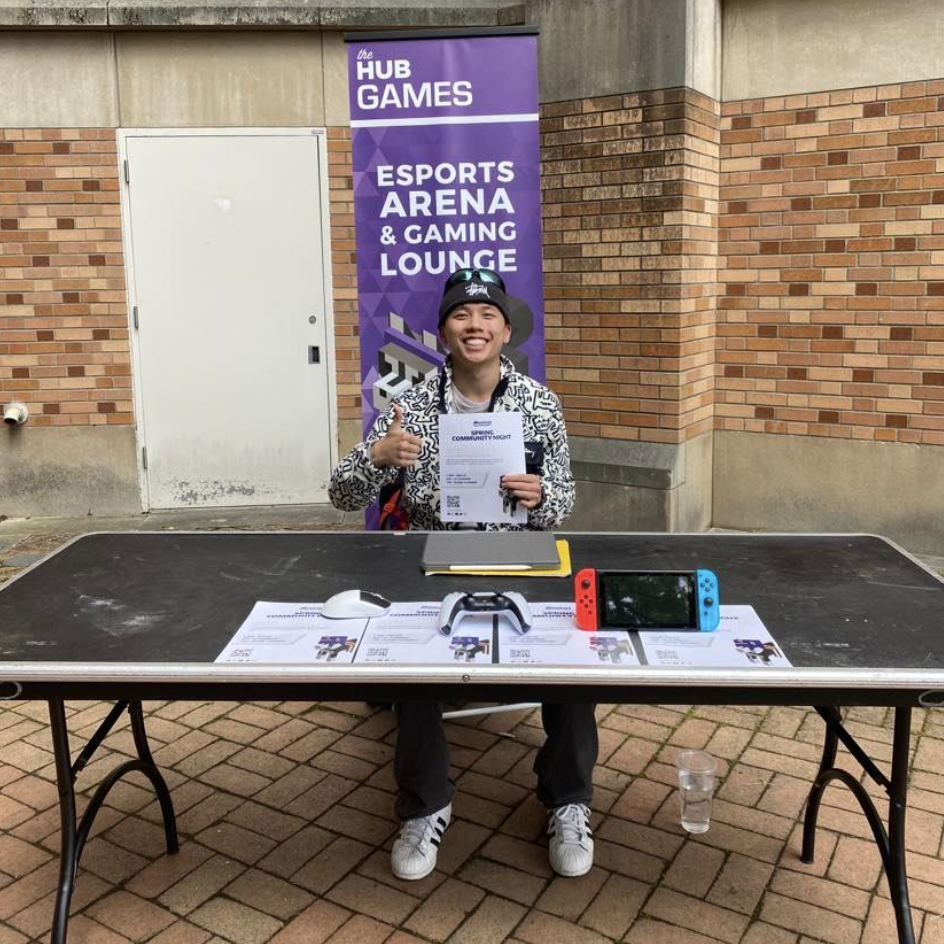
Trevor Nguyen
Map 4 Designer
Wassup, I'm graduating! In my time as undergrad, I've spent most of my time conducting explanatory research relating to the social sciences, I believe that social media data is heavily underresearched in relation to the social sciences. I am curious about the world and what motivates people to particpate in x y z, I do this by conducting my own surveys! Social computing and machine learning has recently grabbed my attention, thus, in the upcoming years I hope to be able to produce various models so that it may aid in my data storytelling.